
SPSS is one of the many statistical packages in the market. Most universities give their students access to SPSS but in case one does not have, he can get a one-month free trial from IBM’s website. The software comes in two versions, one for Windows and another one for Mac operating systems.
In a previous post, I took you through how to code a questionnaire in Microsoft Excel. Data entered into Excel can easily be exported directly into statistical softwares such as SPSS. Another option for data coding is to code it directly into SPSS using the data editor. This post is a guide on how to code a questionnaire directly into SPSS.
The same sample questionnaire used for coding in Excel is also used for this post.
SPSS interface
When you open SPSS, the following window will appear with two views: the data view and the variables view.


The data view
Data view is where raw data entry takes place.
It is also where the raw data is stored once it is entered.
If there is no data, the data view sheet will be greyed out. It will then be activated when data is entered.
The data view has two parts: the columns which show the variables in the dataset, and the rows which show the observations in the dataset. Each column is a unique variable, and each row is a unique observation.
The variable view
The variable view on the other hand shows all the variables in the dataset and their properties.
It is where coding of the data is done.
There are two approaches to coding data in SPSS: before data entry or after data entry.
Coding data in SPSS
To code data in SPSS, first open the variable view. The columns in the variable view represent the properties/characteristics of the variables. The rows represent each unique variable.
Characteristics of variables in variable view
Name
This is the name you give the variable. When naming variables, keep in mind the following conditions:
SPSS does not allow spacing in variable names. If you want to combine two or more words you can use underscore or start each word with a capital letter without any spacing, e.g Education_level or EducationLevel.
SPSS does not allow variable names with special characters such as %, &, $ etc.
The variable names must begin with a letter, not number.
You cannot use the same name for two different variables, each name should be unique.
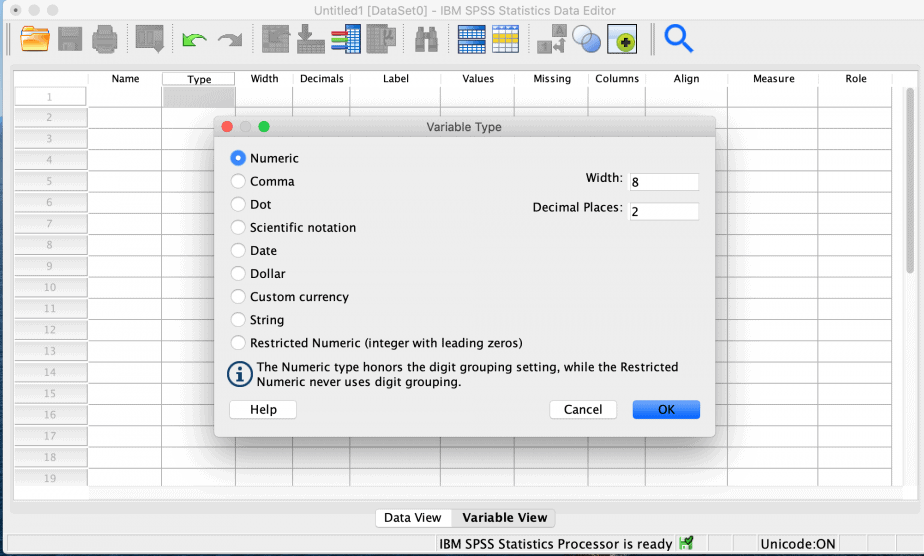
Type
There are 9 types of variables in SPSS but the most common are numeric and string.
Dates are also used in some questionnaires.
Numeric variables are those on which numeric operations can be performed e.g calculating mean, median and statistical tests, whereas for string variables it is not possible to perform numeric operations.
String variables can be represented by letters as well as numbers and include names of respondents, the day the questionnaire was administered etc.
For each variable, specify the accurate type by clicking on the drop-down menu on the right-hand corner, as shown below:

Width
The width of a variable specifies how many characters a variable should have. The default is 8, however, SPSS does not limit the characteristics to the number specified and one can have more characters in the variable.
Decimals
This specifies the number of decimal spaces the variable should have. The default is 2 but you can increase according to your preference.
String variables do not have any decimal place.
Label
The label of a variable is its description. Because variable names are in short form, the labels help to clarify what the variable names stand for. For instance, a variable name “educ” can mean a number of things: number of years of schooling, formal or non-formal education, highest level of education etc. The label therefore clarifies what the variable is about.
Values
Values are used to assign numbers to categorical variables, e.g. female=1, male=2.
To assign values to a variable, click on the drop-down menu on the right-hand corner of values.
A dialogue window will open prompting you to create the values.
As an example, if we want to assign values to education_level variable we will input: 1 as value, pre-primary as label; then click add and input 2 as value, primary as label, add and input 3 as value, secondary as label, and lastly add and input 4 as value, tertiary as label. This procedure is shown in the video below:
Missing
Missing informs SPSS how to treat missing values. There are two types of missing data: user-defined missing values, and system-generated missing values.
System-generated missing values are represented by a single period by SPSS.
User-defined missing values depend on how a researcher defines them.
Columns
This shows the width size of the column. If you increase the column size, the number displayed in the column will increase accordingly.
Align
This shows how the data is aligned in the data view. You can left, right or center align the data.
Measure
This represents the level of measurement of the variable.
There are four levels of measurement namely: nominal, ordinal, interval, and ratio.
Related post: Understanding Types of Data and Levels of Measurement (with Practical Examples)
SPSS does not differentiate interval from ratio data therefore it lumps them together and calls them scale. It however differentiates nominal and ordinal levels of measurement. It is important to correctly specify the level of measurement of each variable because it will affect the analysis of the data.
Sample coded data in SPSS
Based on the sample questionnaire, the data was coded in SPSS as shown in the images below:
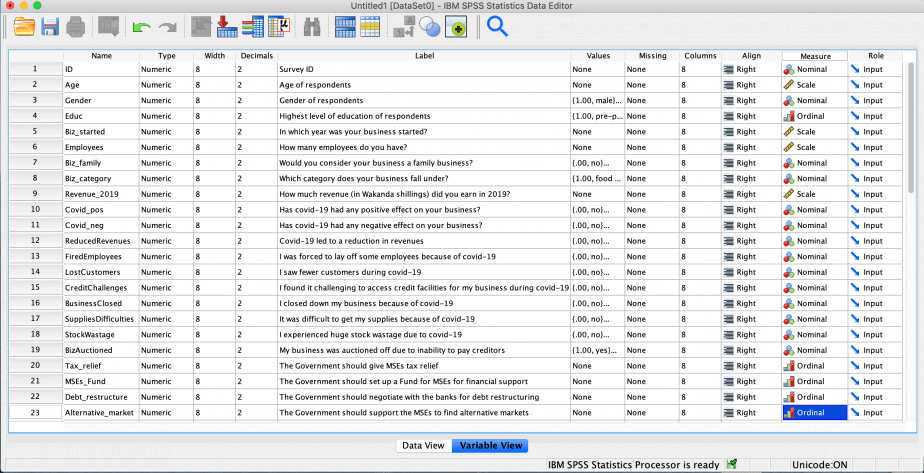

The variables coded in the variable view will appear as the columns of the data view.
In conclusion, it is easy to code data in SPSS as long as one knows the type and nature of the variables one is working with.
Related posts
A Comprehensive Guide for Designing and Administering a Questionnaire
How to Code a Questionnaire in Microsoft Excel (A Practical Guide)
How to Code a Questionnaire in STATA (A Practical Guide)
SPSS Tutorial #1: Introduction to SPSS
SPSS Tutorial #2: Data Manipulation in SPSS
SPSS Tutorial #3: Data Modification in SPSS
SPSS Tutorial #4: Data Cleaning in SPSS
SPSS Tutorial #5: How to Merge Files in SPSS
SPSS Tutorial #6: How to Code, Define, Analyse, and Deal with Missing Values in SPSS
SPSS Tutorial #7: Preliminary Analysis using Descriptive Statistics in SPSS