SPSS stands for Statistical Package for Social Sciences.
It is one of the commonly used softwares used for statistical analyses.
In this post, I introduce SPSS, its interface, and demonstrate how to enter data in SPSS.
- SPSS interface
- SPSS data editor
- SPPS output window
- Entering data in SPSS
- Manual entry of data in SPSS
- Importing data from other files
SPSS interface
When you open SPSS, two windows will open:
SPSS data editor
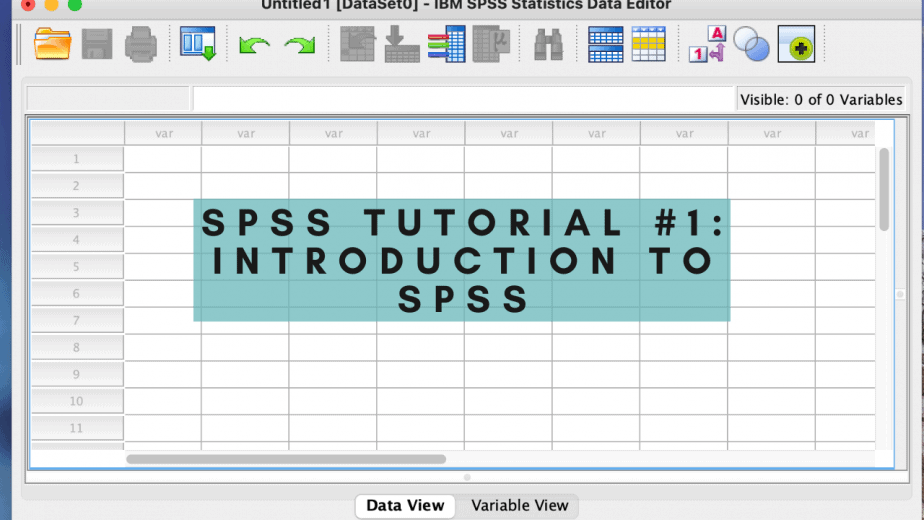
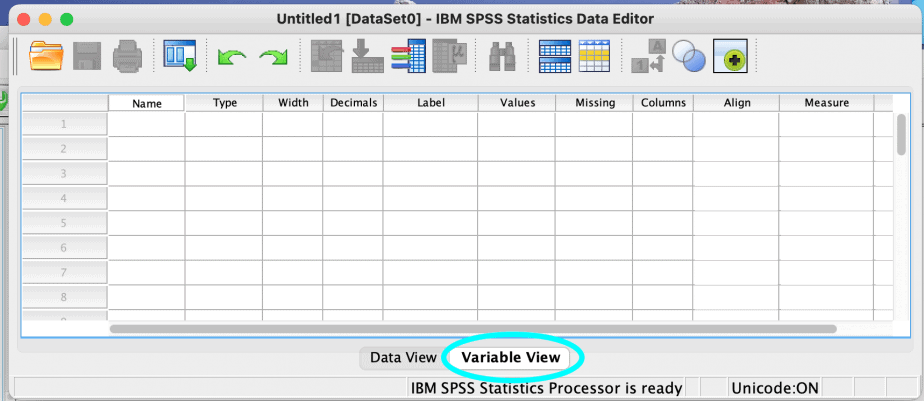
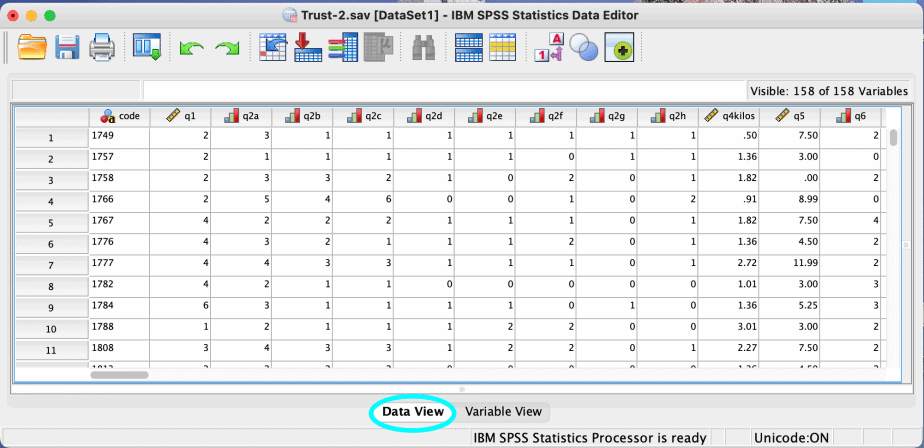
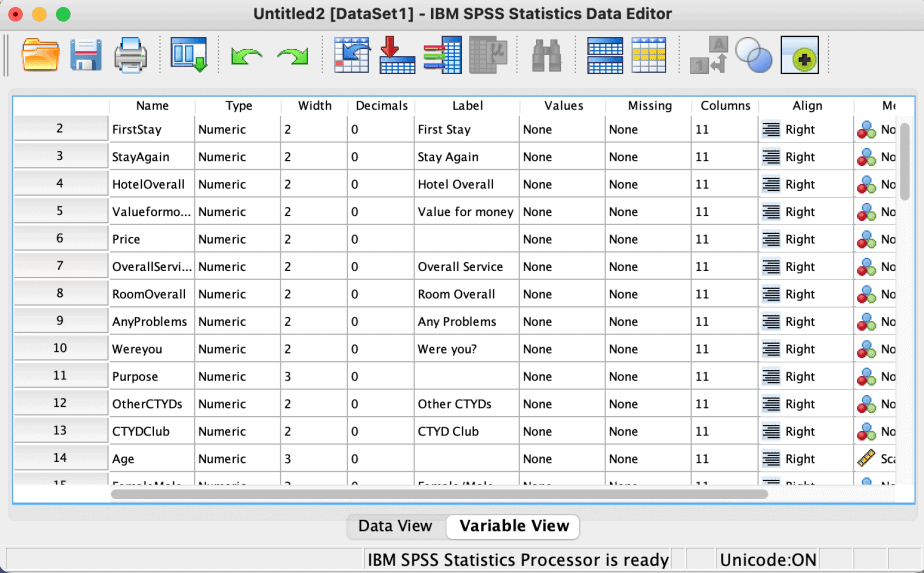
The data editor has two views: the data view and the variable view.
The data view is used to view the data that has been entered.
The columns in the data view represent the variables while the rows in the data view represent the observations/individuals in the dataset.
The variable view shows the properties of the data that has been entered e.g the name of the variables, the type of variables, labels used in the variables if applicable, and the measures used for the variables.
The images below show SPSS data view and variable view when there is no data:
The images below show SPSS data view and variable view when there is data:
SPPS output window
The output window shows all the output of actions taken and the analyses done in SPSS.
The images below show the output window when no action has been taken in SPSS and when data has been entered into SPSS.
Entering data in SPSS
There are two ways of entering data in SPSS: manual entry and importing from other file types.
Manual entry of data in SPSS
The best way to enter data manually in SPSS is to first create the codebook using the variable view of the data editor suing the steps below:
- Open the SPSS and go to data editor, click on variable view.
- Start by specifying the name of the first variable e.g age.
- Next, specify the type of variable e.g numeric.
- Enter the width of the variable name.
- Enter the number of decimal places you would like the data to take.
- Enter the label of the variable. This provides a description of the variable name. For example, for the age variable, the label can be “age of respondents in years”.
- Enter the values if applicable. This is used when we have a nominal or ordinal variable whose value labels need to be specified e.g for gender one can have male=1, female=2.
- Specify how you want the missing values to be treated.
- Next, specify the column.
- Next, specify the alignment of the data e.g right, left or centre alignment.
- Most importantly, specify the type of measurement for the variable. SPSS treats the ratio and interval variables as scale measurement. It therefore has only three options for the measurement, that is, scale, ordinal and nominal. For the age variable, the measurement would be scale. The type of measurement of a variable will influence the type of statistical analysis that can be performed on it.
The details for the first variable, age, will appear in the variable view as shown in the first image below. The variable “age” will also appear in the data view as the first item on the first column, as shown in the second image below:
After the codebook for all the variables has been completed, then you can enter the data in the questionnaires using the data view.
It is important to number the questionnaires because each questionnaire will be entered on a separate row in the data view: questionnaire 1 will be entered in row 1, questionnaire 2 will be entered in row 2 etc.
Numbering the questionnaires also helps in case you want to check whether the data was entered correctly (quality control/checks).
Importing data from other files
Besides manual entry of data in SPSS, one can also import data if the data is in other files or format, for instance, Microsoft Excel, STATA, SAS, etc.
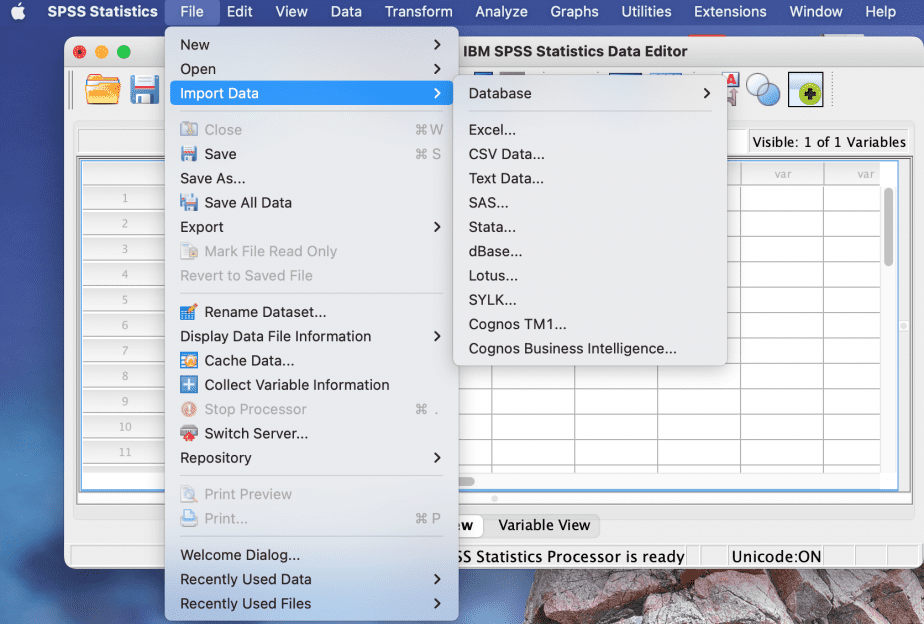
To import data into SPSS, go to the file menu > import data > choose the type of file you want to import e.g Excel
This is shown in the image below:
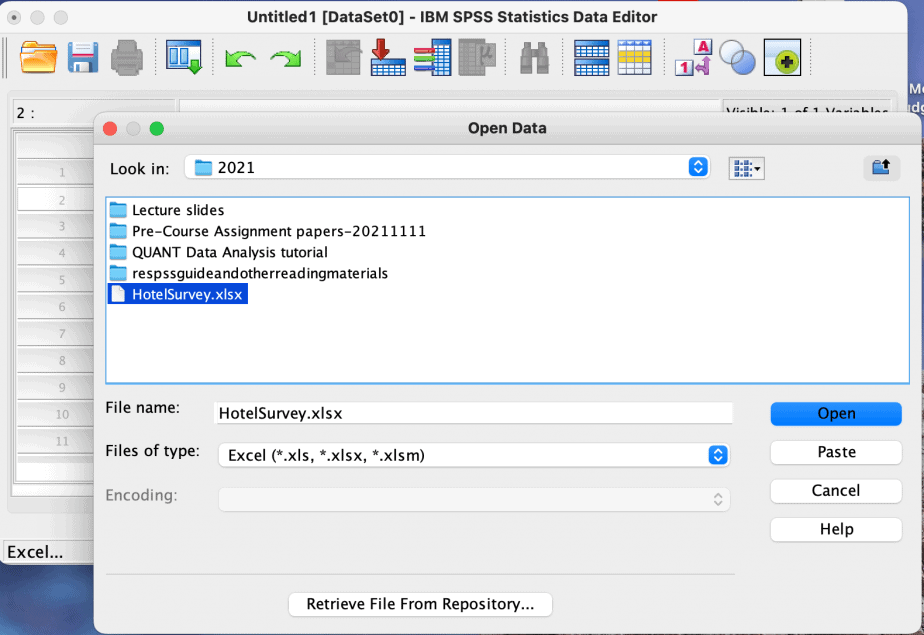
A dialogue box will open prompting you to locate the file, then click open:
After clicking “open”, another box will open with various checkboxes as shown below:
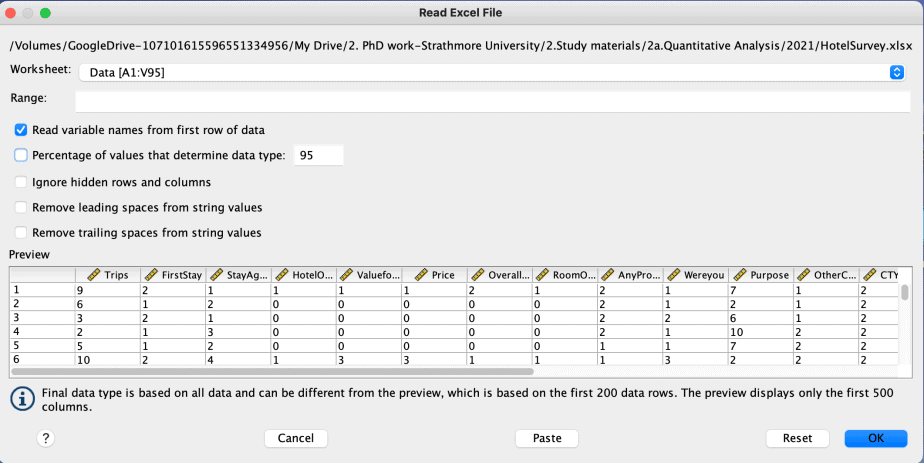
Check the first checkbox to import the variable names from Excel to SPSS and then click OK.
SPSS allows the variable names to have a maximum of 8 characters: if they are more than 8 characters, SPSS will truncate them.
The data in the Excel file is imported into SPSS, as shown below:
After importing the data into SPSS, it is important to go through both the data view and variable view to see if all the details are correct e.g the variables’ labels, the value labels and the measurement of the variables.
Once you have your data in SPSS, the next step is to explore the data and manipulate it as desired. This is covered in the second SPSS tutorial.
In conclusion, SPSS is one of the most common statistical softwares used for data management and analysis. In this first post in my SPSS tutorial series, I have introduced SPSS and its interface and demonstrated how to enter data into SPSS either manually or by importing from other files.
Related posts:
How to Code a Questionnaire in SPSS (A Practical Guide)
SPSS Tutorial #2: Data Manipulation in SPSS
SPSS Tutorial #3: Data Modification in SPSS

