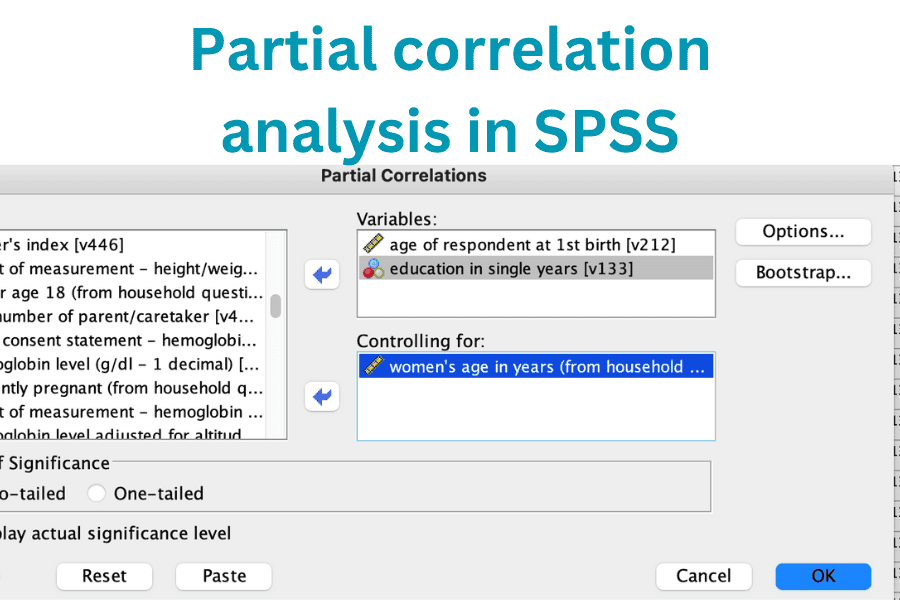
Partial correlation is almost similar to Pearson product-moment correlation only that it accounts for the influence of another variable, which is thought to be correlated with the two variables of interest. This post discusses how to run and interpret partial correlation in SPSS.
Partial correlation analyses the correlation between two variables while controlling for a third or more variables, known as confounding variables. This is important because confounding variables distort the size of the correlation coefficient of two variables if they are not controlled for.
Requirements for partial correlation
To run partial correlation, one requires:
- Two variables of interest for which one wants to explore their correlation.
- Another variable (confounding variable) for which one wishes to control.
Assumptions of partial correlation
Like the Pearson product-moment correlation, partial correlation also works with the following two assumptions:
- The variables are normally distributed.
- The variables are continuous, that is, either ratio or interval variables.
How to run partial correlation in SPSS
In order to run partial correlation in SPSS:
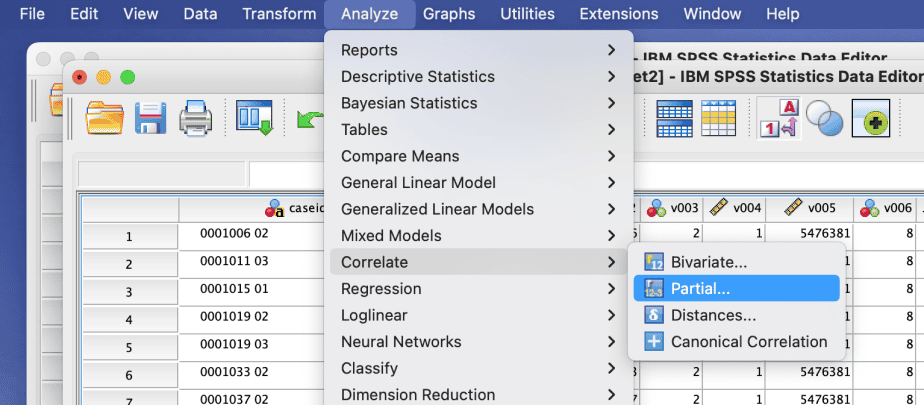
- Go to SPSS menu > Analyze > Correlate > Partial
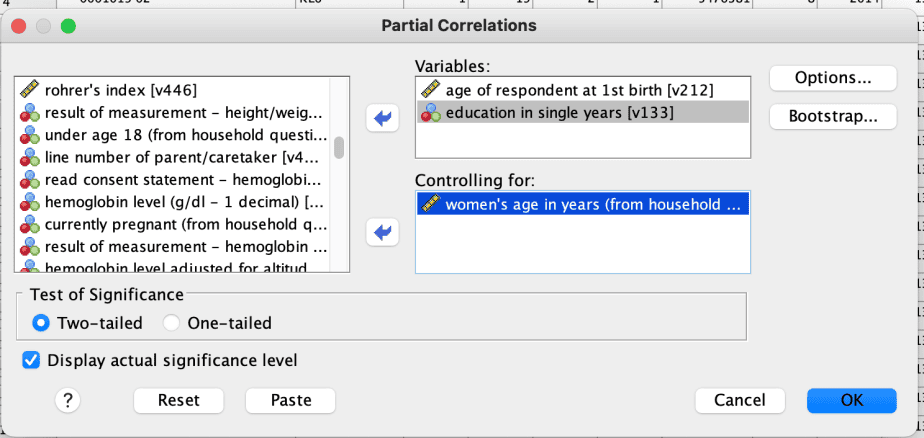
- From the partial correlations dialogue box, select the two variables of interest for which you want to test correlation and move them into the Variables box.
- Select the variable that you wish to control for and move it into the Controlling for box.
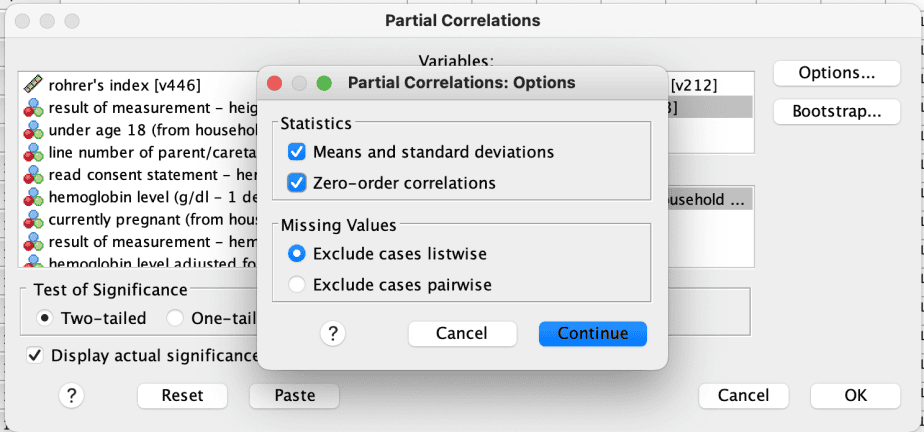
- Click the Options button and:
- Select Means and standard deviations and Zero-order correlations in the Statistics section.
- Select Exclude cases pairwise in the Missing Values section.
- Click Continue then OK.
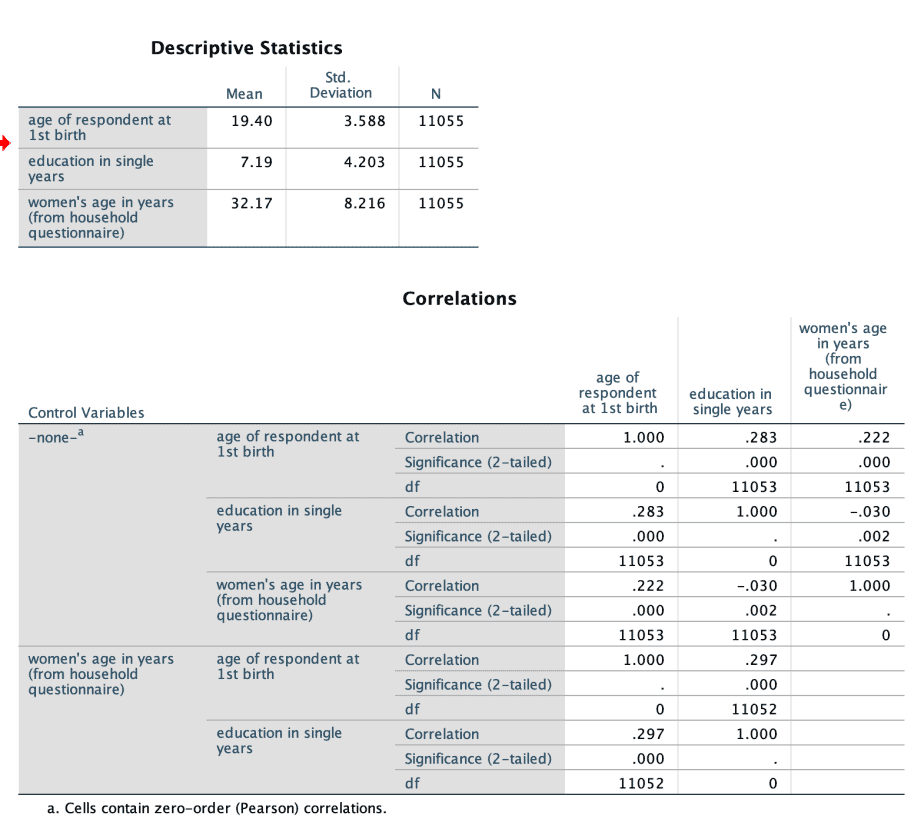
The following output will be produced.
Interpretation of partial correlation output in SPSS
The output produced will have two distinct sections: descriptive statistics and correlations results.
The descriptive statistics will show the mean and standard deviations of the variables.
The correlations output also has two distinct parts.
The first part displays the normal Pearson product-moment correlation coefficients (without controlling for the third variable), and their significance levels.
The second part displays the partial correlation coefficients with the influence of the confounding variable removed, and their significance levels.
If the third variable is a true confounding variable, the correlation coefficient of the two variables will be significantly different in the two sections. If the variable is not a confounding variable, there will not be much difference in the size of the correlation coefficient of the two variables in the two sections.
In the example above, the Pearson coefficient of “age of respondent at first birth” and “education in single years” is .283 whereas the partial correlation coefficient of the same variables after controlling for “women’s age in years” is .297. The two coefficients are not much different hence we can conclude that “women’s age in years” does not influence the correlation between the two variables.
Conclusion
Partial correlation is used to analyse the correlation between two continuous variables while controlling for the influence of a third (or more) variables which are thought to influence the two variables. If the third variable is a confounding variable, there will be a significant difference in the Pearson and partial correlation coefficients.
Similar posts
SPSS Tutorial #11: Correlation Analysis in SPSS

