Before you start analysing your data, it is important to clean it first so that you start with a clean dataset. Data cleaning in SPSS involves two steps: checking whether the dataset has any errors, then correcting those errors. This post will demonstrate these two steps of data cleaning in SPSS.
- Checking for errors
- Checking for errors in categorical variables
- Checking for errors in continuous variables
- Correcting the errors in the dataset
- Related posts
Checking for errors
Checking for errors in SPSS depends on whether the variable is categorical or continuous.
Checking for errors in categorical variables
To check for errors in categorical variables, follow the steps below:
First ensure that the value labels for the categorical variables are turned on by following the procedure below:
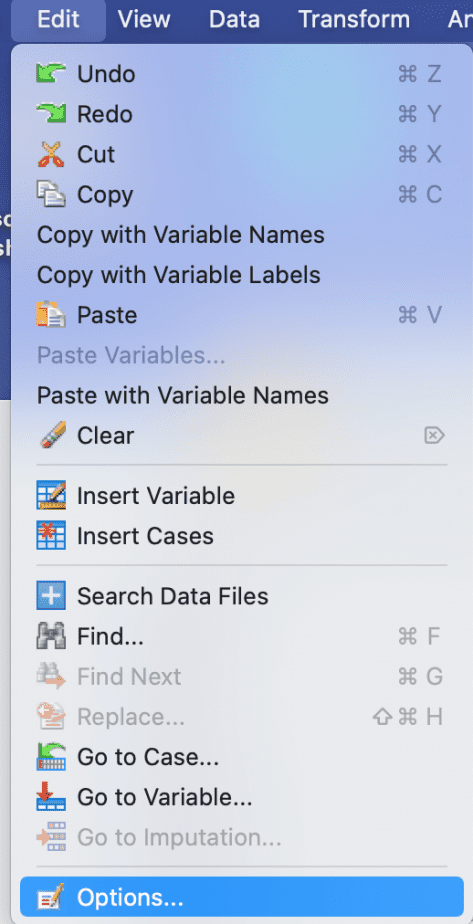
- Go to the Edit menu and choose Options.
- Under the Output tab, go to the last box titled “variable values in labels shown as:” and select “values and labels” from the drop-down menu, then click OK.
This is demonstrated below:
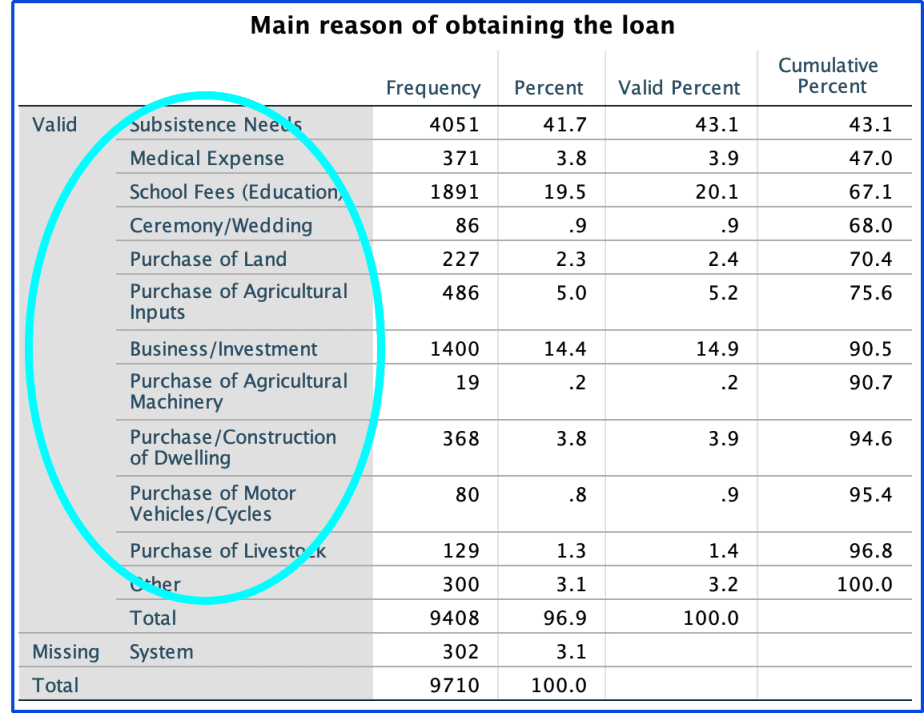
The following images show value labels turned off and value labels turned on, respectively.
It is important to turn on the value labels so that you can see clearly where the errors are for categorical variables.
To check for errors in categorical variables, follow the procedure below:
- Click on Analyze > Descriptive statistics > Frequencies.
- Choose the variables that you want to check for errors for > click on the arrow button to move the variable to the variables box.
- Click on statistics button > select minimum and maximum from the Dispersion section.
- Click continue > OK.
The images below demonstrate the procedure:
In the above example, the variable of interest is called “source of credit over the last 12 months” and has 14 different categories of sources of credit and a category for other sources of credit.
However, the dataset shows 2 instances where a code “16” was entered into the dataset, which is an error because there was no category 16.
It is important to correct this error before data analysis is done.
Checking for errors in continuous variables
To check for errors in continuous variables, follow the procedure below:
- Click on Analyze > Descriptive statistics > Descriptives.
- Choose the variable of interest and click on the arrow button to move it to the variables box.
- Click on the Options button > select mean, standard deviation, minimum and maximum.
- Click continue, then OK.
The above procedure is demonstrated in the images below:
Check if the statistics make sense. Do the minimum and maximum values make sense, given the nature of the variable? Do the mean and standard deviation make sense? If there is an outlier in the data, the mean will be affected.
In the example above, the variable of interest is “annual interest rate” on loans/credit and the maximum value is 600, which does not make sense.
Once you have identified the errors, the next step is to correct them.
Correcting the errors in the dataset
There are two ways of correcting errors in a dataset, depending on whether you have access to the original questionnaires or not.
Before correcting the errors, you need to find where the errors are in the dataset.
If you have a large dataset, it is tedious and time-consuming to find errors manually. Using the “sort” option is a more efficient technique.
To sort data, follow the procedure below:
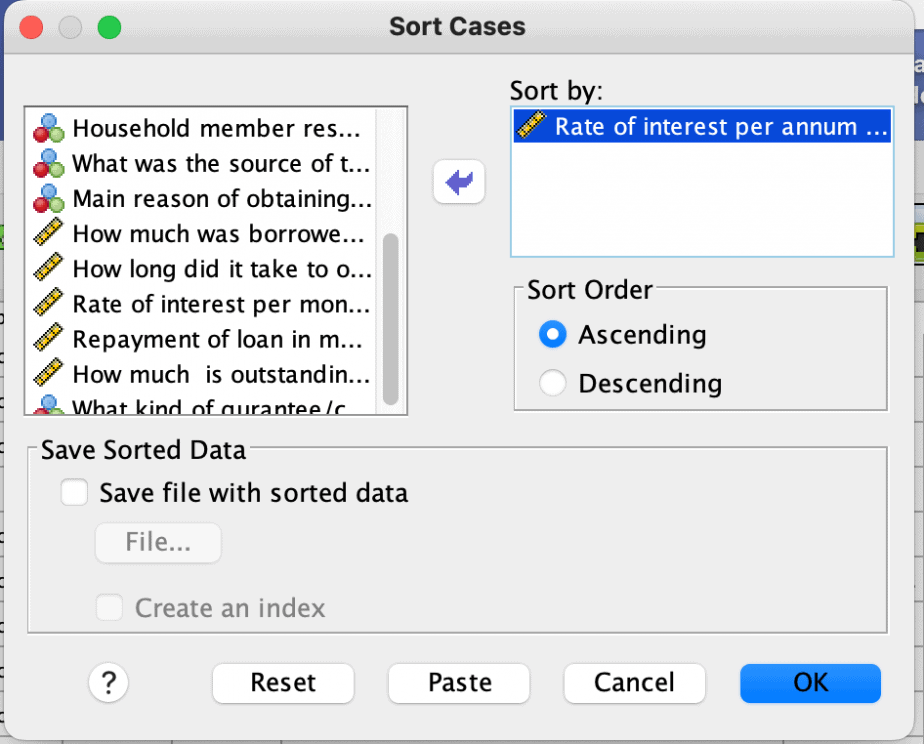
- Click on the Data menu > choose sort cases.
- Click on the variable that you know has an error > click on the arrow to move it to the “sort by” box.
- Click on either ascending or descending order. Ascending order means that you start with the lowest value to the highest value, while descending order starts with the highest value to the lowest value.
- Click OK.
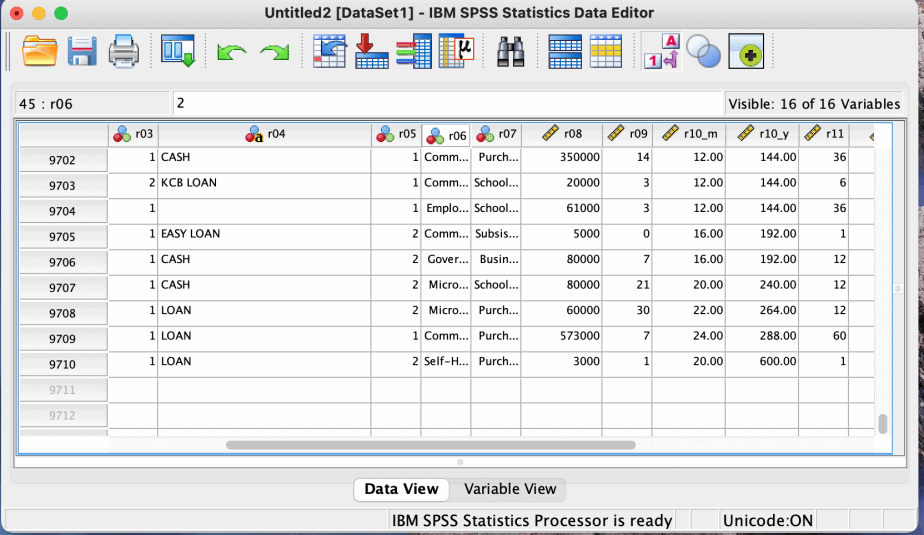
In the Data Editor window, select the data view tab and use the variables columns to find the variable with the error. You should be able to find the error in the dataset.
The above procedure is demonstrated in the images below using the variable “annual interest rate.”
Once you have identified the error in the dataset, it is time to clean it using one of two techniques described below:
- If you have access to the original questionnaire, simply check the ID number of the affected questionnaire and cross-check with that questionnaire if there was an error during the data entry process, then correct the error in the data file.
- If you do not have access to the original questionnaire, simply delete the error in the data file. SPSS will assign a system missing value, which is denoted as a full stop in the data file.
After correcting the errors, it is important to repeat the error check once more to ensure that no other errors exist.
In conclusion, the results of your study largely depend on whether you used a clean dataset for your analysis. Whereas data cleaning seems like a tedious process, it is an important preliminary step before any data analysis is done and should be allocated adequate time.
Related posts
How to Code a Questionnaire in SPSS (A Practical Guide)
SPSS Tutorial #1: Introduction to SPSS
SPSS Tutorial #2: Data Manipulation in SPSS


