STATA is one of the common statistical programmes in the market. Unlike SPSS, STATA has both drop-down menu and command functions.
One can enter data into STATA either from a spreadsheet like Excel or directly into STATA using the data editor. This post is a practical guide on how to code a questionnaire directly in STATA.
STATA’s interface
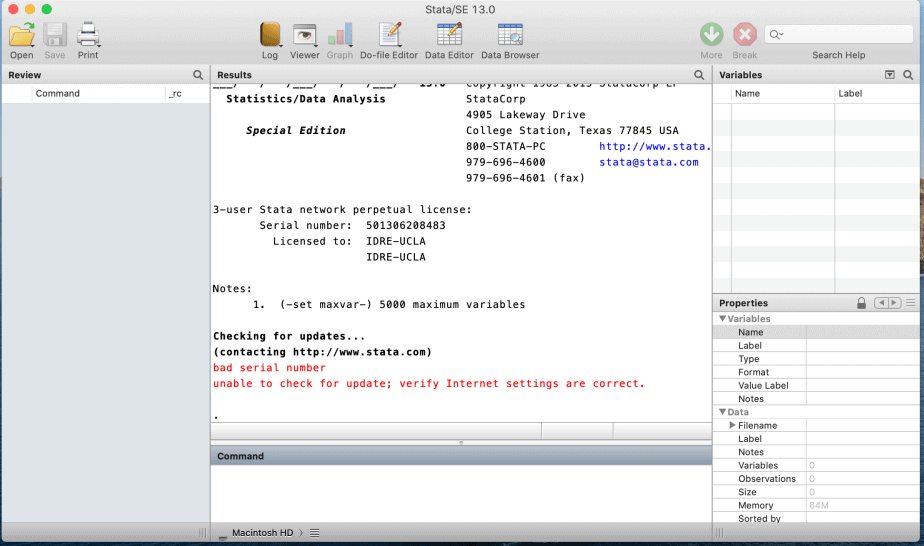
The interface of STATA looks like the image below.

The interface has four windows, namely: command, results, review and variables windows.
The command window is where the user types all his commands for data management and analysis.
The results window displays the results of the command. For example, if the command is to find the mean of a dataset, the results will appear on the results window.
The review window displays all the commands that have been used.
The variables window displays all the variables in the dataset and their properties.
Coding data in STATA
To enter and code data in STATA, the data editor is used. When the data editor is double-clicked, a window opens with two parts: the spreadsheet part and the variables part. Data is entered into the spreadsheet, while the properties of the variables can be changed on the variables pane.
Practical example
Assuming we had a short questionnaire with seven questions:
- What is your age? _____________
- What is your gender? 1. Male 2. Female
- What is your highest level of education? 1. Pre-primary 2. Primary 3. Secondary 4. Tertiary
- Which year was your business started? _____________
- How many employees does your business have? ______________
- Is your business a family business? 1. Yes 2. No
- In which category of business does your business fall? 1. Food and beverage 2. Wholesale and retail 3. Manufacturing 4. Distributor 5. Health 6. Home and textiles 7. Professional services 8. Others
To code the above data into STATA:
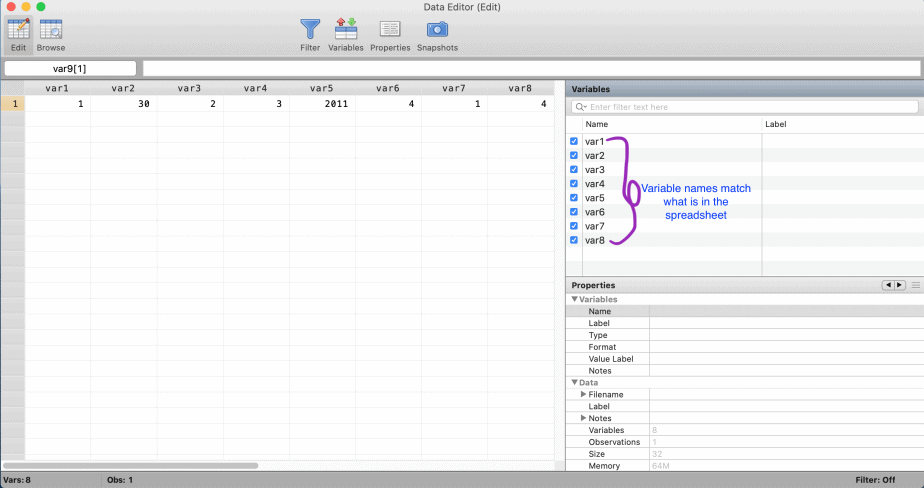
- Open the data editor. On the spreadsheet, the columns represent the variables, while the rows represent the observations.
- The first column should be an identification variable to help differentiate the questionnaires.
- Take the first questionnaire and enter the data. When you do, STATA will give the variables names such as var1, var2, var3, … etc. See the image below:

When you finish entering the first questionnaire, it is time to code the data before data from the other questionnaires are entered.
- The first step is to change the names of the variables from the generic to specific names that users of the dataset can easily recognise. This is done in the “properties” section of the variables pane.
The variables names will be changed to:
var1 = ID; var2 = age; var3 = gender; var4 = education; var5 = biz_started; var6 = employees; var7 = biz_family; var8 = biz_category
- The second step is to insert the labels of the variables. Labels are the descriptions of the variables which inform users what the variables represent.
The video below shows how to change the names and labels of the variables:
STATA will automatically insert the type and format of the variables. There are two types of variables: numeric and string. Numerical operations can only be performed on numeric data. String data on the other hand are data in the form of words or a mixture of words and numbers. STATA colour-codes numeric data as black (or blue) and string data as red. For example if we had entered male in var3 instead of 2, STATA would have coloured “male” in red.
- The third step involves adding value labels to categorical variables. In the example above, the categorical variables are: gender, education, family business and business category.
Adding value labels in STATA involves three steps: i) generating label name for each of the categorical variables; then ii) creating the value labels, and lastly iii) assigning the value labels to the variables.
To add value labels, one can either use the data menu > data utilities > label utilities. Alternatively, one can use the command window to type in the commands. The video below demonstrates how to add value labels from the data menu:
Final thoughts on how to code a questionnaire in STATA
Coding a questionnaire is not difficult. There are many ways of going about it.
The most common way of coding questionnaires is using a spreadsheet like Microsoft Excel to enter and code the data and then exporting the data to statistical programmes.
The other alternative is to code and enter the data directly into the statistical programmes such as SPSS and STATA. The choice of coding strategy is purely a matter of personal preference.
Coding data from questionnaire however requires the researcher to know a number of things: the type of data that each variable has, the level of measurement of each variable, the rules of naming variables for each programme, and how to add value labels to categorical variables.
Related posts
How to Code a Questionnaire in SPSS (A Practical Guide)
How to Code a Questionnaire in Microsoft Excel (A Practical Guide)
A Comprehensive Guide for Designing and Administering a Questionnaire


