
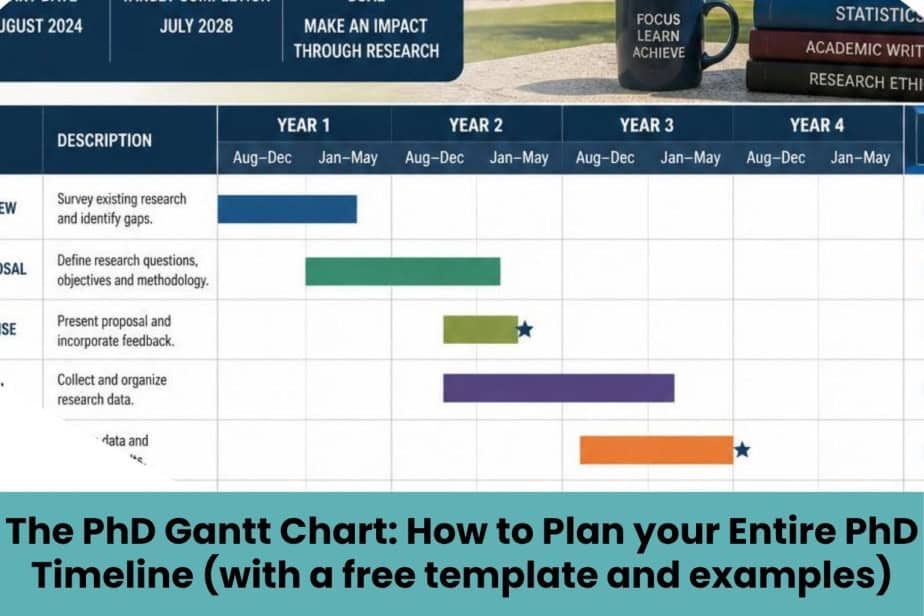
A PhD is one of the longest projects you will ever manage — and like any long project, it needs a plan you can actually see. A PhD Gantt chart is the single tool that turns a vague, multi-year commitment into a visual, month-by-month roadmap you can follow, adjust, and defend to your supervisor.
In this guide, you will learn what a Gantt chart is, why it matters more for PhD students than almost any other planning tool, how to build one from scratch (with a full worked example), which software to use, and the mistakes that cause most students to abandon theirs by month four.
- What Is a Gantt Chart?
- Why PhD Students Need a Gantt Chart
- Gantt Chart vs. Other Planning Tools
- How to Create a PhD Gantt Chart: Step by Step
- Sample PhD Gantt Chart
- Best Tools for Building a PhD Gantt Chart
- How to Effectively Use Your PhD Gantt Chart
- Common Mistakes to Avoid
- How Often Should You Update It?
- Gantt Charts for Different PhD Structures
- Frequently Asked Questions
- Final Thoughts
What Is a Gantt Chart?
A Gantt chart is a horizontal bar chart used in project management to schedule and track tasks over time. Each bar represents a task or deliverable; its position and length show when the task starts, how long it lasts, and when it ends. Originally developed for industrial and engineering projects, Gantt charts are now used across almost every field that involves multi-step, multi-month planning — including academic research.
For a PhD student, the “project” is your entire program: coursework, exams, proposal, data collection, papers, and the dissertation itself. The Gantt chart is simply the map of all of it, laid out against a calendar.
Why PhD Students Need a Gantt Chart
A PhD typically runs from three to six years depending on your university, department, and funding structure. Without a written plan, it is dangerously easy to lose track of how much time remains versus how much work is left. A Gantt chart addresses this directly:
- It is easy to create. You can build one with pen and paper, or with free digital tools — no project management background required.
- It is easy to read at a glance. The visual layout tells you instantly what should be happening this month, without re-reading a long document.
- It makes progress visible. Colour-coding tasks as “not started,” “in progress,” or “complete” gives you an honest, immediate picture of where you stand.
- It anchors your monthly, weekly, and daily planning. Once the big milestones are mapped, breaking them into smaller weekly targets becomes far easier.
- It gives your supervisor a shared reference point. A Gantt chart is a natural document to bring into supervision meetings — it turns vague check-ins (“how’s it going?”) into concrete conversations about specific milestones.
- It surfaces conflicts early. Laying every deliverable on one timeline often reveals that two major tasks — say, a conference submission and data collection — are scheduled to collide. Better to discover that in month one than month eighteen.
Gantt Chart vs. Other Planning Tools
Gantt charts aren’t the only way to plan a PhD, and it helps to know when each tool should be used.
| Tool | Best for | Limitation for PhD planning |
| Gantt chart | Long-term, multi-year timelines with dependencies (e.g., “data collection can’t start until ethics approval is granted”) | Less useful for daily task management |
| To-do list / daily planner | Day-to-day and weekly execution | No visibility into the multi-year picture |
| Kanban board (Trello, Notion) | Tracking the status of many small, parallel tasks | Doesn’t show duration or a fixed calendar timeline well |
| Calendar/scheduling app | Fixed appointments, deadlines, meetings | Poor for showing tasks that span weeks or months |
Most successful PhD students end up using a Gantt chart for the big picture and a to-do list or Kanban board for weekly execution — the two are complementary, not competing.
How to Create a PhD Gantt Chart: Step by Step
Step 1: List every deliverable in your program
Start broad. A typical PhD with coursework and a dissertation component might include:
- Coursework, divided into modules
- Comprehensive written exam
- Oral exam
- Concept note
- Research proposal and proposal defense
- Data collection and analysis
- Journal article submissions
- Conference paper presentations
- Dissertation chapters and final defense (viva)
Pull this list directly from your program handbook — don’t rely on memory, since missed formal requirements are one of the most common causes of delayed graduation.
Step 2: Assign start and end dates to each deliverable
For each item, estimate a realistic start and end date, working backwards from your target graduation date where useful, and forwards from your actual start date where the sequence is fixed (e.g., you cannot collect data before your proposal is approved).
Step 3: Build the chart
Use Microsoft Word, Excel, PowerPoint, or a dedicated Gantt tool (see the comparison below) to lay out your tasks as horizontal bars against a monthly or quarterly timeline.
Step 4: Make it visible
Print it and put it somewhere you’ll see daily — above your desk, inside your planner, or as your desktop wallpaper. A Gantt chart that lives in a forgotten folder does no good. If you work digitally, pin it to your dashboard or set a recurring calendar reminder to review it.
Sample PhD Gantt Chart
The chart below assumes a 3-year PhD program with both coursework and a dissertation, starting January 2026.
| Year of study | Task/Activity | Start–End |
| Year 1 | Module 1 | January 2026 |
| Module 2 | April 2026 | |
| Module 3 | July 2026 | |
| Module 4 | October 2026 | |
| Concept note | June 2026 | |
| Comprehensive exam | November 2026 | |
| Year 2 | Proposal defense | March 2027 |
| Business management case study | April – June 2027 | |
| Journal article 1 submitted | June 2027 | |
| Data collection and cleaning | July – September 2027 | |
| Data analysis | October – November 2027 | |
| First conference paper presented | November 2027 | |
| First dissertation draft submitted | December 2027 | |
| Year 3 | Second conference paper presented | March 2028 |
| Two journal articles submitted | May 2028 | |
| Revision and finalization of manuscript | January – October 2028 | |
| PhD viva | November 2028 |
Once mapped, this same information can be turned into a visual bar chart in the tool of your choice (see below).
Best Tools for Building a PhD Gantt Chart
| Tool | Cost | Good for | Notes |
| Microsoft Excel | Paid (or free via student license) | Students who want full control over dates/formulas | Use stacked bar charts; many free templates exist |
| Microsoft PowerPoint | Paid (or free via student license) | Simple, visually clean charts for printing or presenting to supervisors | Manual — no auto-scheduling |
| Microsoft Word | Paid (or free via student license) | Quick, low-fuss charts using tables or SmartArt | Least flexible for complex timelines |
| Google Sheets | Free | Cloud-based, easy to share with supervisors | Requires add-ons or manual bar formatting |
| TeamGantt / Smartsheet | Freemium | Students who want drag-and-drop scheduling and dependencies | Free tiers are limited to 1–3 projects |
| GanttProject | Free, open-source | Students who want dedicated Gantt software without a subscription | Slightly dated interface |
| Notion / Trello / ClickUp | Freemium | Students who want to combine their Gantt-style timeline with task tracking in one workspace | True Gantt views often require paid plans |
If you’re not sure where to start, Excel or PowerPoint remain the most accessible options — most universities provide free Microsoft licenses, and the learning curve is minimal.
To further support you in building your PhD Gantt chart, we have developed a free Gantt chart template that you can customise for studies. Download it below:
How to Effectively Use Your PhD Gantt Chart
Building the chart is only step one. Using it well is what makes the difference.
- Plan each month in advance. At the start of every month, check what your chart says should be happening, and prepare accordingly. If Module 1 and early proposal groundwork overlap, start reading around your topic and discussing it with your supervisor before the module even begins.
- Identify skill gaps early. If your chart shows a business case study or a Stata/SPSS/NVivo-based analysis coming up in six months and you don’t yet have that skill, that’s your cue to enrol in a short course now rather than scrambling later.
- Plan around external events. Conferences, funding deadlines, and fieldwork seasons all have their own timelines. Mark abstract submission deadlines and registration windows on your chart as soon as you identify relevant conferences.
- Break long tasks into monthly and weekly targets. A 15-month proposal-writing phase feels abstract and easy to deprioritise. Break it down, for example:
| Month | Task |
| 1–3 | Literature search and review |
| 4 | Write Chapter 1 |
| 5 | Share Chapter 1 with supervisor |
| 6 | Address comments |
| 7–8 | Write Chapter 2 |
| 9 | Share Chapter 2 with supervisor |
| 10 | Address comments |
| 11–12 | Write Chapter 3 |
| 13 | Share Chapter 3 with supervisor |
| 14 | Address comments, finalize proposal |
| 15 | Defend proposal |
- Build in buffer time. This monthly plan assumes your supervisor reviews chapters within the scheduled window — which won’t always hold. Add margin around any milestone that depends on someone else’s turnaround time.
- Go weekly or daily if it helps. Break monthly targets into a target number of pages written, sources read, or citations added per week. Small, trackable units make long tasks feel achievable.
Common Mistakes to Avoid
- Making it once and never updating it. A Gantt chart is a living document, not a one-time exercise. Life happens — supervisors take longer than expected, ethics approval gets delayed, health issues arise, babies can be born during the PhD program. A chart that isn’t updated becomes a source of guilt rather than guidance.
- Ignoring dependencies. Don’t schedule data collection to start the same month your proposal defense is scheduled. Map which tasks must finish before others can begin.
- Being unrealistically optimistic. First-time Gantt charts are almost always too ambitious. Add 15–20% buffer time to major milestones, especially ones involving supervisor or ethics board turnaround.
- Making it too detailed too early. Trying to plan daily tasks for year three in month one wastes effort on estimates that will certainly change. Keep distant milestones broad, and get more granular as they approach.
- Keeping it private. A Gantt chart that only you see can’t help you get support. Share it with your supervisor — it becomes a tool for accountability and a talking point in supervision meetings.
How Often Should You Update It?
As a rule of thumb:
- Review monthly — check whether you’re on, ahead of, or behind schedule.
- Revise after any major milestone — a proposal defense, a comprehensive exam, or a supervisor’s feedback round is a natural point to re-forecast the months ahead.
- Do a full rebuild once a year — as your research evolves, entire sections of your original plan may no longer apply.
Gantt Charts for Different PhD Structures
Not every PhD looks like the example above. Adjust the framework to your program:
- Coursework-heavy programs (common in the US and parts of Africa): Dedicate the first 12–18 months primarily to modules and comprehensive exams, with proposal work beginning in parallel during the later coursework months.
- Research-only programs (common in the UK, much of Europe, and Australia): Coursework largely disappears; the chart instead front-loads literature review and proposal/upgrade milestones (e.g., MPhil-to-PhD transfer) within the first 9–12 months.
- STEM/lab-based PhDs: Data collection is often iterative rather than a single block — build in multiple shorter experiment/analysis cycles instead of one long data collection phase.
- Humanities and qualitative social science PhDs: Fieldwork, archival access, and transcription often take longer than planned — build extra buffer specifically around access-dependent tasks (e.g., waiting on archive permissions or interview scheduling).
Frequently Asked Questions
How far in advance should I create my PhD Gantt chart? Ideally within your first month of enrolment, once you have your program handbook and requirements in hand. It’s far easier to adjust an existing plan than to build one retroactively after months of drift.
What software is best for a PhD Gantt chart? For most students, Excel or PowerPoint are the simplest starting points since they require no new subscription and most universities provide free licenses. Students managing very complex, multi-dependency timelines may prefer dedicated tools like TeamGantt or GanttProject.
Should my Gantt chart include personal milestones? Many students find it helpful to add non-academic milestones — parental leave, planned travel, funding renewal dates — since these directly affect available working time.
Can a Gantt chart help with my proposal specifically? Yes — proposal writing is one of the phases most students underestimate. Breaking it into a monthly plan (as shown above) is one of the most effective ways to avoid the common trap of rewriting Chapter 1 repeatedly without visible progress.
Final Thoughts
A PhD is a medium- to long-term project, and like any project of that scale, it needs a visible plan — not just a mental one. A Gantt chart is one of the simplest, most accessible tools available for this: easy to create, easy to read, and flexible enough to adapt as your research inevitably changes course.
Build it early, revisit it monthly, and don’t be afraid to revise it — the goal isn’t a perfect plan, but a clear enough one that you always know what should be happening next.