Outliers are data values that are different from most of the data values in a dataset. They can either be extremely high or extremely low compared to the rest of the data values. This post illustrates how to identify and deal with outliers in SPSS.
Outliers are caused by: errors during data entry or measurement errors.
It is important to identify and address outliers because in many cases they can interfere with data analysis results.
How to identify outliers in SPSS
There are several ways of identifying or checking for outliers in SPSS. The most common and simplest methods are graphical methods, particularly using box plots or scatter plots.
Using box plots to identify outliers in SPSS
Box plots are used to explore the distribution of continuous variables.
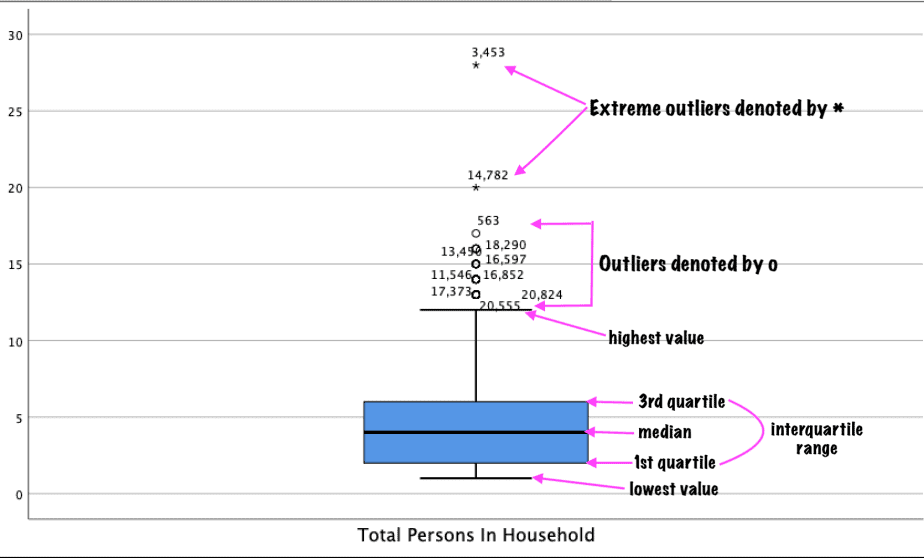
Each distribution of scores is represented by a box and protruding lines called whiskers.
The length of the box represents the interquartile range of the variable (that is, the difference between the quartile 3 and quartile 1 of a distribution). It contains half of the scores of the variable.
The line running across the inside of the box is the median value.
The whiskers run from the box to the lowest value (bottom of the box) and to the highest value (top of the box) of the variable.
Data values that SPSS considers to be outliers will be shown as small circles with numbers attached to them.
Additionally, data values that SPSS considers to be extreme values will be shown as asterix with numbers attached to them.
An example of a box plot with outliers is shown below:

Using scatter plots to identify outliers in SPSS
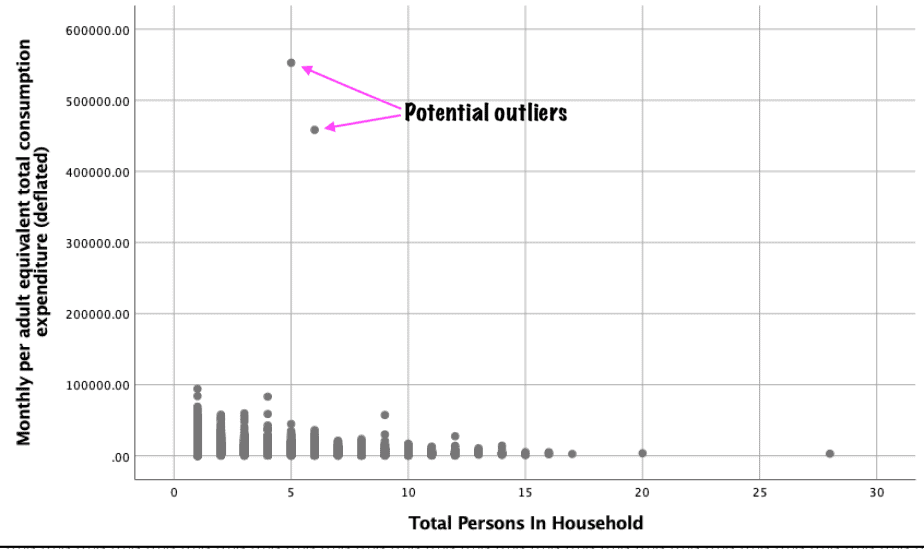
In addition to box plots, scatter plots can also be used to identify outliers in a dataset.
Scatter plots display the relationship between two continuous variables.
Any outliers in the two variables will be shown as far off from the correlation pattern.
An example of a scatter plot with outliers is shown below:

How to deal with outliers in SPSS
Dealing with outliers depends on the cause of the outlier.
If the outlier is as a result of a data entry error, you can correct the error if you have access to the raw data.
If the outlier is a true outlier or if you have no access to the raw data, you may remove it from the dataset if it is likely to significantly affect the data analysis.
The third option of dealing with outliers is to assign a different value to the outlier value, the most common one being assigning the mean of that variable to the outlier.
Conclusion
In summary, an outlier is a data value that is significantly different from the rest of the data values of a variable in a data set. It may be caused by a measurement error or a data entry error, or it may be a true outlier.
It is important to identify and detect an outlier in a dataset before any data analysis is conducted because it can significantly alter the data analysis results.

