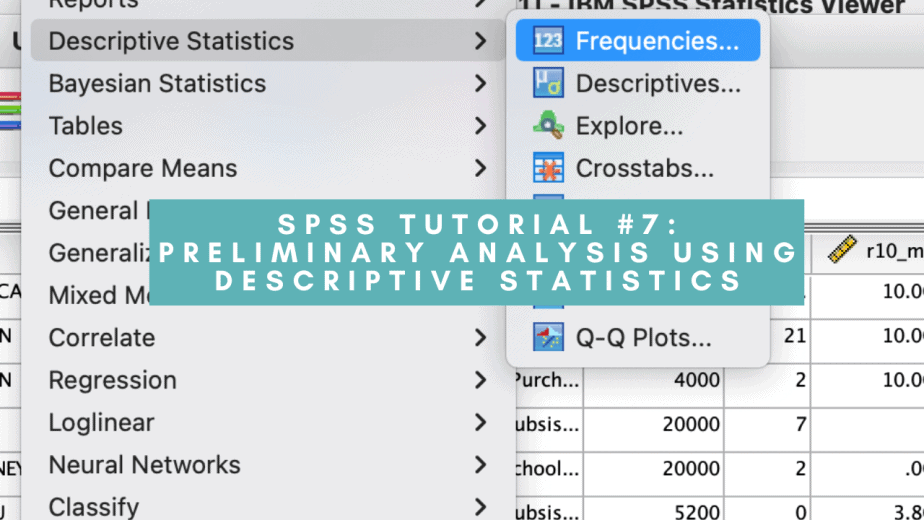
After checking for and correcting errors in your dataset, the next important step before running your analysis is to conduct preliminary analysis to explore the nature of your data. One can conduct preliminary analysis using descriptive statistics or graphs. This post focuses on descriptive statistics in SPSS.
Descriptive statistics play two major roles:
- They describe the nature of the data and the variables
- They help to check for violation of assumptions behind the statistical techniques.
- The assumptions vary from one statistical technique to another and it is important for a researcher to know them and to know how to check for their possible violation.
Descriptive statistics in SPSS using Codebook
The Codebook feature allows one to quickly get a summary of the data.
To perform the Codebook function, follow the procedure below:
- Click Analyze menu > Reports > Codebook
- In the Codebook dialogue box, click on the variables tab, select the variables you want and move them to the codebook variables box.
- In the same dialogue box, click on the output tab and select Label, Value Labels and Missing Values from the variable information list.
- In the same dialogue box, click on the statistics tab and select all the options listed under counts and percents and central tendency and dispersion.
- Click OK.
The procedure is demonstrated in the images below:
The output will show different statistics for categorical and numerical variables.
For categorical variables, only the count and percentages will be displayed.
For numerical variables, the mean, standard deviation and quartiles will be displayed.
Some examples are shown in the images below:
Descriptive statistics for categorical variables
Besides the Codebook, one can get information on categorical variables using the frequencies feature.
To do this, follow the procedure below:
- Click Analyze menu > Descriptive statistics > Frequencies
- Select the variables of interest and move them to the variables box
- Click OK.
This is demonstrated in the images below:
Interpreting the Frequencies output for categorical variables

The output from the Frequencies table has the following key information:
- The frequency of cases in each category of the variable.
- The percentage of cases in each category of the variable.
- Number and percentage of valid and missing cases in each category of the variable.
Descriptive statistics for continuous variables
Besides the codebook, you can also use the Descriptives feature in SPSS to obtain more information about continuous variables.
To do this, follow the procedure below:
- Click on Analyze menu > Descriptive statistics > Descriptives
- From the dialogue box that opens, select all the continuous variables of interest and move them to the variables box
- Click on Options
- Tick the mean, standard deviation, minimum, maximum, skewness and kurtosis
- Click Continue > OK.
This is demonstrated in the images below:
Interpreting the Descriptives output for continuous variables

The output has the following key information:
- The number of valid cases for each variable.
- The minimum and maximum values for each variable.
- The mean for each variable.
- The standard deviation for each variable.
- The skewness statistic and its standard error for each variable.
- Skewness measures the symmetrical nature of the data.
- There are three types of skewness: left (or positive) skewness, right (or negative) skewness, and zero skewness.
- Left skewness: data points are concentrated on the left, with the tail towards the left of the distribution graph.
- Right skewness: data points are concentrated on the right, with the tail towards the right of the distribution graph.
- Zero skewness: data points are symmetrical and hence the distribution is normal.
- The kurtosis statistic and its standard error for each variable.
- Kurtosis measures the peakedness of the data, that is, how high or flat the data points are distributed.
- There are two types of kurtosis: positive and negative.
- Positive kurtosis indicates high peakedness of the data points, with long thin tails.
- Negative kurtosis indicates a flat distribution of the data points, with many data points on the extreme tails.
In conclusion, this post has explained and illustrated how to conduct preliminary analysis using descriptive statistics in SPSS. Descriptive statistics for both categorical and continuous variables have been explained using the appropriate SPSS functions for each variable type. Preliminary analysis is a crucial step before conducting any advanced data analysis.
Related posts


