What is Stata?
Stata is a statistical software package used for data entry, data cleaning, data manipulation, data analysis, and data visualization in quantitative research studies. It was developed and owned by StataCorp.
In this first of a series of Stata-related tutorials, I discuss the Stata interface, Stata menu, Stata toolbar, do-files and ado-files, log files, viewing and editing data, changing Stata’s settings, and where to find help on Stata.
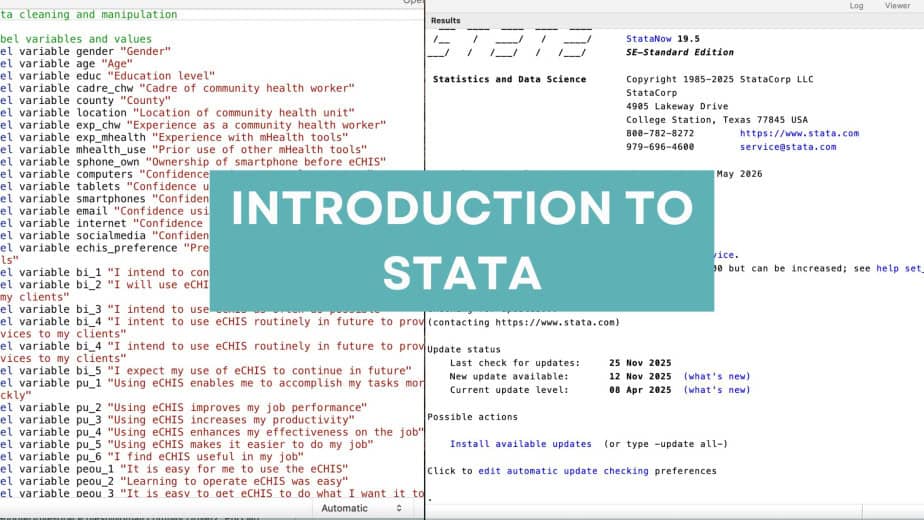
The Stata Interface
The main interface of Stata has 4 or 5 sections, depending on your computer’s operating system (Windows or Mac).

1. Results window
The results window displays the results of your work.
You can interact with blue text in the results window, but not with the black text.

You can also copy the results in the results window by highlighting the results, right-clicking on it, and choosing ‘Copy’ (or ‘Copy Table’, ‘Copy HTML’, or ‘Copy as Picture’).

The results window also allows you to change the preferences (e.g., colours) of the results by right-clicking anywhere with no text and then choosing preferences.

2. Command window
This is where you interact with Stata by typing in the commands that you would like Stata to execute.

Any commands that are typed in the command window will be displayed and executed in the results window.
3. Variables window
The variables window displays all the variables in a dataset.
It will show the name and label of each variable in the dataset.

4. Properties window
Right below the variables window is the properties window.
It displays the properties of the variables, e.g., variable name, variable type, format, value label, and any notes if available.

The properties window has a lock that prevents a user from accidentally changing the properties of a variable.
To unlock it, just click on the lock icon.

5. Review/history window
For Windows users, the review window appears on the left side of the results window.
This window displays all your previous commands executed.
For Mac users, this window is called history and can be accessed by clicking on the history icon right above the variables window.

You can change the size of the windows by dragging them either left or right.
Stata menu
At the top of the Stata interface is the Stata menu, which includes File, Edit, View, Data, Graphics, Statistics, User, Window, and Help menus.

Stata toolbar
Below the Stata menu is the Stata toolbar, which includes Log, Viewer, Graph, Do-file Editor, and Data Editor.

Stata do files
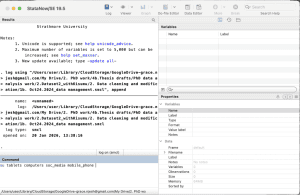
A Stata do-file is a text file that has commands and instructions for Stata to execute.
To start a new do-file, go to the Stata toolbar, click on the Do-file editor, and select “New Do-file Editor”.

A new do-file editor will be opened. Type in the commands you would like Stata to execute for you, then save the do-file. It is important to save the do-file with a name that can easily be recognised and understood.

Example of a do-file:

The green sentences starting with asterix are notes and are not executed by Stata.
Sentences or phrases starting with the blue texts are the ones that will be executed by Stata.
Do-files are often confused with ado-files. An ado-file is a text file that contains a Stata program.
Most of the Stata commands are .ado files.
Stata log files
Log files are used to save your work and output in a different file.
Log files display the commands that were executed and the results from those commands.
The benefit of using log files to save your work is that you can always go back to them to see what you did or to copy the results to a different document.
You can either start a new log file, view an existing log file, or amend an existing log file
Stata does not automatically start log files; the user must start the log files.
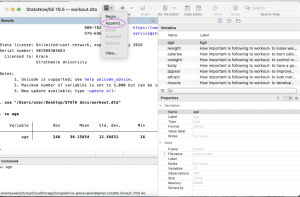
To start a new log file, go to the Stata toolbar, then click on log, then choose “Begin”. This will begin a new log file.

The “create new log” dialogue box will open. Specify the name of the log file and location, then click Save.

The new log file will be started. Any commands executed and the accompanying results will be saved in the new log file.

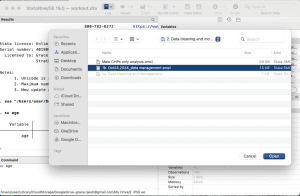
To append an existing log file, go to the Stata toolbar, then click on log, then choose “Append.” A new dialogue box will open to allow you to choose the log file you want to append to. Select the log file, then click Open.
In the command window, type and execute the commands you want to add to the log file.
The new commands and results will be appended to the log file.
To view a log file, go to the Stata toolbar, then click on log, then choose “View.” Specify the file’s URL or use the browse function to locate the file, then click OK.

The log file will be opened.

To close a log file, go to the Stata toolbar, then click on log, then choose “Close.” Alternatively, you can use the “log close” command.

This will close the active log file.

Editing data – data editor
If you want to make changes to your data, you use the data editor.

Viewing data – data browser
Used to view the existing data without making any changes to it.
You cannot make any changes to the data in the browse mode.

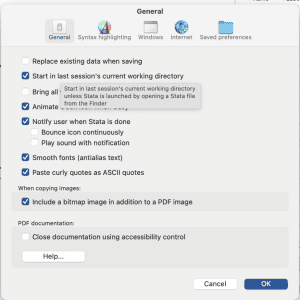
Changing the settings of Stata – Stata Preferences
You can change the default settings of Stata by using Stata Preferences.
For Windows users, Stata Preferences is located on the Edit menu.
For Mac users, Stata Preferences is located on the Stata menu: Go to Stata menu > Settings .

The preferences are of three types: General preferences, Graph preferences, and user-interface language preferences.
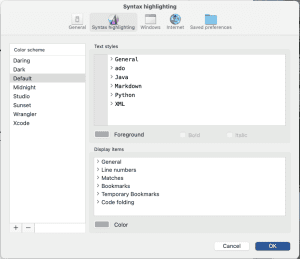
1. General preferences

General preferences settings include: general tab, syntax highlighting tab, windows tab, internet tab, and saved preferences tab.
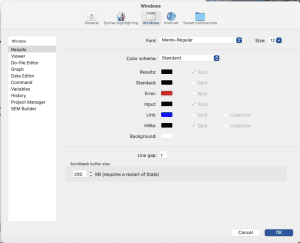
An important result window setting is the scrollback buffer size setting. It is recommended to increase the scrollback buffer size from the default minimum of 200 to a maximum of 2000.

This enables the user to see 10 times their results, which is helpful when you have a lot of results to display.

2. Graph preferences

Graph preferences are useful for changing the colour scheme and fonts of your graphs.

There are about 72 different colour schemes available in Stata, including the scheme for the Stata journal as well as the Economist publication.

Different graph schemes have different ways of displaying the graphs generated in Stata.
Finding help in Stata
There are various ways through which you can find help in Stata.
The help command: simply type “help” in the command window, followed by what you need help with. For instance: help sem
The help menu: You can use the search bar to search for more information on what you need.
Stata PDF guide: The Stata PDF guide has all the modules available in Stata, along with the various commands and examples of application of the commands.
Other useful resources: the Stata website is also a great resource for finding help on Stata. The website has links to webinars, trainings, video recordings, and other helpful resources for Stata users.
Additionally, the Stata forum – Statalist – provides members with the opportunity to ask questions and interact with other Stata users. I encourage you all to visit these resources if you want to become proficient in using Stata.
Practice Exercise
- Open Stata
- Change the colour scheme of your results window to classic
- Change the scheme of your graphs to the Stata journal
- Start a new log file with the name “Introduction exercise 1_log file.”
- Create a do-file with the name “Introduction exercise_do-file” and write the following command:*Summary statistics, su age school tenure
- Save the do-file and close it.
- Close the log file with the command syntax.