After you are done collecting data in Kobo Toolbox, you can perform some preliminary data management in Kobo Toolbox before exporting the data to another program for analysis. In this post, I share the most common data management functions available in Kobo Toolbox.
Data entry summary
The summary section has: the project information, submissions dashboard, quick links, data, and team members.

i. Project information
The project information section has the project’s description, status (whether deployed, in draft or archived), the number of questions, the project owner, who edited the form last, when the form was last edited, when it was last deployed, when the last submission was made, the sector in which the project belongs, and the country in which the project is implemented.
ii. Quick links
In this section, quick links are provided for collecting data, sharing the project, editing the form, and previewing the form.

iii. Submissions dashboard
The submissions dashboard shows the number of submissions received at different points in time: in the past 7 days, in the past 31 days, in the past 3 months, and in the past 12 months.
The submissions are provided in the form of a chart.
iv. Data
The data section provides various functions for data management, including a table showing the data, reports, gallery, downloads, and map functions.
v. Team members
This section shows all the team members of a project.
Kobo Toolbox reporting feature
Kobo Toolbox has a reporting feature that displays descriptive reports of the data collected. There are two types of reports available in Kobo Toolbox: default reports and custom reports.
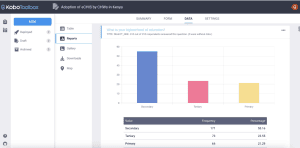
i. Default reports
The default report shows the reports for each question in the form.

The reports will vary depending on the type of data.
Also read: Understanding Types of Data and Levels of Measurement (with Practical Examples)
For categorical data, the reports will be vertical bar charts, with the table of data at the bottom showing the frequency and percentage for each category.
For continuous data, the reports will be descriptive statistics in the form of a table showing the mean, median, mode, and standard deviation.

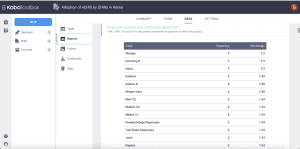
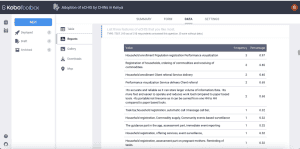
For open-ended questions, the responses will be displayed in a table with each unique response presented in a row together with its frequency and percentage.
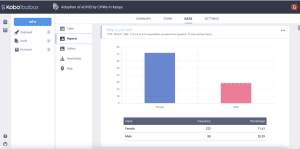
ii. Custom reports
Custom reports show the reports of the questions selected by the user. Hence, a user can specify the questions they would like to display in the reports.
In the example below, only the demographic and mHealth experience-related questions have been selected, hence the report only shows charts and statistics for the demographic and mHealth experience questions.
To create a custom report, click on the + sign next to the default report button. It will appear as “create new report.”

Next, in the custom report dialogue box that opens, type the name of the custom report, then select the questions you would like to be included in the report.
Lastly, click save at the bottom of the dialogue box.

The custom report will be displayed, showing the name of the report and the report for each of the questions selected.

Configuring reports
You can choose how you would like your reports to appear by using the “configure report style” option.

There are three ways of configuring report styles:
i. Changing the chart type
The default chart is the vertical bar chart.
However, Kobo Toolbox provides other types of charts that can be used in the reports. These include horizontal bar charts, line, pie, area, donut, polar area, and radar charts.

ii. Changing the colours of the reports
Kobo Toolbox provides 5 different colour palettes that can be used in the reports, including multi-colours and monochrome palettes.
Simply select the palette that appeals to you, and the reports will be created in those colours.

iii. Grouping the reports
This feature is useful if you would like to create reports for different groups. For instance, reports for females vs. males, reports for different age groups, for different professional cadres, or for different locations (rural vs. urban)
The grouping by variable must be a categorical variable and must be available in the form.

In the example below, we grouped the default reports by the cadre of community health workers (community health assistants and community health promoters).

The reports on the sex of the respondents are presented, showing the male and female respondents by community health assistants and community health promoters.

Similarly, the reports on the education level of the respondents are presented, showing the education level for the community health assistants and the community health promoters separately.

Viewing data
You can view the data/submissions received by using the Table feature.

The rows in the table represent individual respondents, whereas the columns represent individual questions in a form.
Validating data
You can validate the data received. There are three options for validating data: a) not approved, b) approved, and c) on hold.
To validate data, go to the Table, then go to the submission you want to validate. Under the validation column, click on the drop-down arrow and select the option that is most suitable.

Editing data
Kobo Toolbox allows a project owner or other users with permission to edit data.
Editing data is an important data management process that helps to reduce errors and ensure that the data in the final file is of high quality and credible.
To edit data from the Table, go to the submission you want to edit, click on the edit icon next to the “eye” icon. That particular submission will be opened in a new tab.

Edit the data as necessary, then click on the submit button at the bottom of the page. The form will now be updated reflecting the changes made.

You can also edit data by selecting the submission of interest, then clicking on the edit button at the top of the form. This will also open the form in a new tab which will allow you to edit the data.

Deleting data
You can delete data that is no longer needed. For instance, if you have submissions that were used to test the questionnaire, you can delete these submissions before the actual field work begins.
To delete data, select the submission you would like to delete, then click on the delete button at the top of the form.

A warning will be displayed. Choose “delete selected”. The data will be deleted permanently from your records.

The gallery feature
The gallery is where all the images and videos collected from forms are stored.

The map feature
The map feature is used for forms that have location point questions.

Downloading data
After you have done all the changes you wanted to make on the data, you are now ready to download the data from Kobo Toolbox to use in a different program for analysis, e.g., Microsoft Excel, SPSS, Stata, NVivo etc.
To download data, click on the Downloads tab.

From the downloads options, specify the export type you want. There are different export types provided in Kobo Toolbox: XLS, CSV, GeoJSON, SPSS Labels, GPS coordinates, XLS (legacy), and media attachments.

Next, specify the value and header format for your data.

There are two types: a) Labels, and b) XML values and headers.
Labels use text in the headers and in the responses as they appear in the form. On the other hand, XML values and headers use codes for the headers and responses.
As an example, a question asking, “What is your age?” will appear exactly as that if the value and header format selected is labels. On the other hand, the question will appear as “age” if the XML values and headers was selected.

You can also choose to apply any saved export setting to future exports.

Lastly, Kobo Toolbox keeps a record of all downloads at the bottom of the downloads page.
The record shows the export type, the date created, the language used, whether there are groups included, and multiple versions.
For each export record, you can either download it or delete it.

In conclusion, Kobo Toolbox has powerful data management functions and features which allow a user to perform preliminary data analysis and make any required changes to the data before the data can be downloaded and used in a different program.
Related posts